MDT - Professional Version
Version:8
Languages:English;Spanish;Portuguese;Chinese(Simplified)
Size: 540 MB
Update Date:2019-11-04
Industry:Civil
Required application:ZWCAD+2014 Pro, ZWCAD+2012 Pro, ZWCAD 2019 Pro, ZWCAD 2020 Pro

![]()
Introduction
The Professional Version is designed to assist users in all the phases of carrying out a Surveying project. Its main users include the public administration, construction companies, engineering firms, architects, town planners, companies dedicated to earthworks, quarries, mining firms, environmental companies, etc., as well as independent professionals.
Surveying points
The program begins with the coordinates, which are obtained from any total station or GPS, by converting files from data collectors or from other application through a powerful format manager. It has a CAD-independent point viewer, with view controls, 3D orbit…
Points are intelligent CAD objects, so that they can be deleted, moved, changed to another layer, by using standard CAD commands, or can be blocks with attributes, making the drawing fully compatible with other CAD applications. In addition, any kind of editing operation can be executed, for instance interpolating, changing heights, sorting by levels, filtering, assigning codes, labeling coordinates, grouping points, changing their visibility, and so on. Coordinates can be changed by using an editor similar to an electronic sheet. Selection can be made by number, level, height, group, code or graphically. Each point can be associated to a document, drawing or photograph via a hyperlink. Points can have alphanumeric names and it is possible to display points with different shapes and colors within the same drawing.
New points can also be converted from CAD objects drawn by other programs (points, circles, crosses, blocks with or without attributes…), with the option to detect the entity type via graphic designation. The program then automatically draws the break lines using its database, in which layers, colors, line types, thickness and point codes can be defined.
It is possible to assign each code to different blocks for top view, front view and 3D rendering in order to create a realistic view.
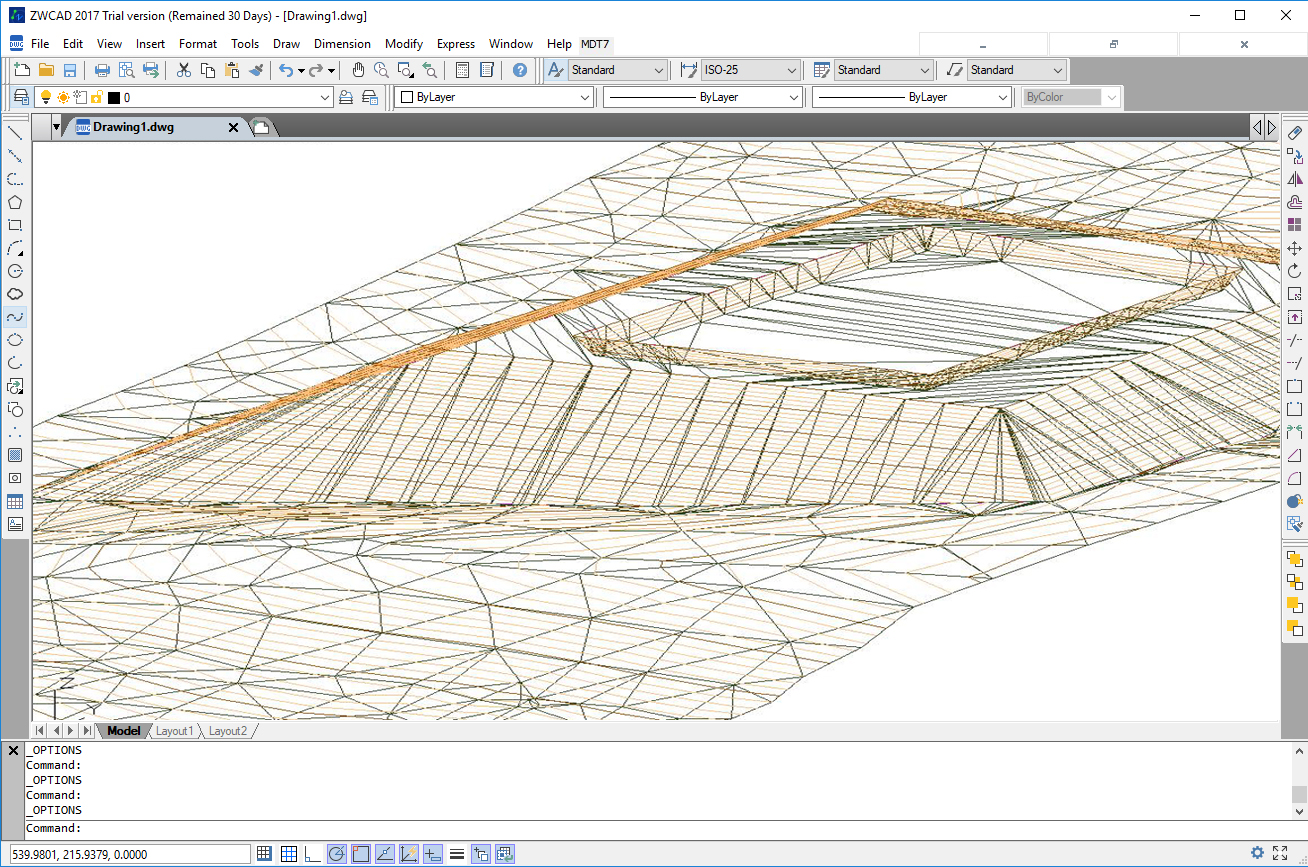
Surfaces
Break lines can be graphically defined through point sequences, codes or by importing files. Tools are available to detect loose vertices, points on a line, crosses and surface inconsistencies. It can also repair mistakes or mark the errors.
Triangulation can be created from points, break lines or contours, controlling maximum length and minimum angle as well as removing the flat triangles.
Surfaces can have multiple boundaries or islands, and they can be drawn as lines, 3D faces or polyfaces. The result can be displayed in a CAD-independent surface viewer.
There are commands to create fixed or variable-height subgrades, earthworks by terrain or leveling heights, as well as calculating the modified terrain using an alignment and the cross-sections generated.
Other utilities compute the optimum height to balance cut and fill volumes, earthworks along upper and lower slopes, or slopes between surfaces.
Another command creates a surface based on NASA SRTM (Shuttle Radar Topography Mission) data. This allows users to create an approximate digital model of any area of the planet by giving its coordinates.
Also it’s possible to convert terrain point clouds in LIDAR format to mesh or surface.
Contour Lines
MDT can generate contour lines with a constant interval, or at special heights. They are automatically updated for every change in triangulation.
Commands to add vertices, edit contour lines, discretize polylines and splines, etc.
Contours can be labeled in automatic or manual mode with customization of the style, size and layer. Another command allows to place additional height labels at any location on the surface.
There are also other commands to add vertices, edit contours and discretize polylines and splines.
MDT Professional version includes also utilities for generalization and smoothing using different algorithms, as well as tools to trim and join contour lines, perform manual or automatic interpolation, check contour heights and many more.
Horizontal Alignments
Horizontal alignments that will be used in profiles and cross-sections can be defined by polylines, parameters or importing files.
MDT includes tools for fitting lines, curves and clothoids, allowing user to control radii and parameters while respecting road regulations. The alignment is automatically dimensioned, and its vertices can be edited.
MDT can generate coordinate reports, as well as computing distances and intersections among several alignments.
A segment can be defined by putting together the horizontal and vertical alignment, superelevations and widenings, profiles, cross sections, templates and optionally blocks to be inserted in profile drawings or 3D views.
Once created terrain can be checked, and we can draw the final profiles or cross sections.
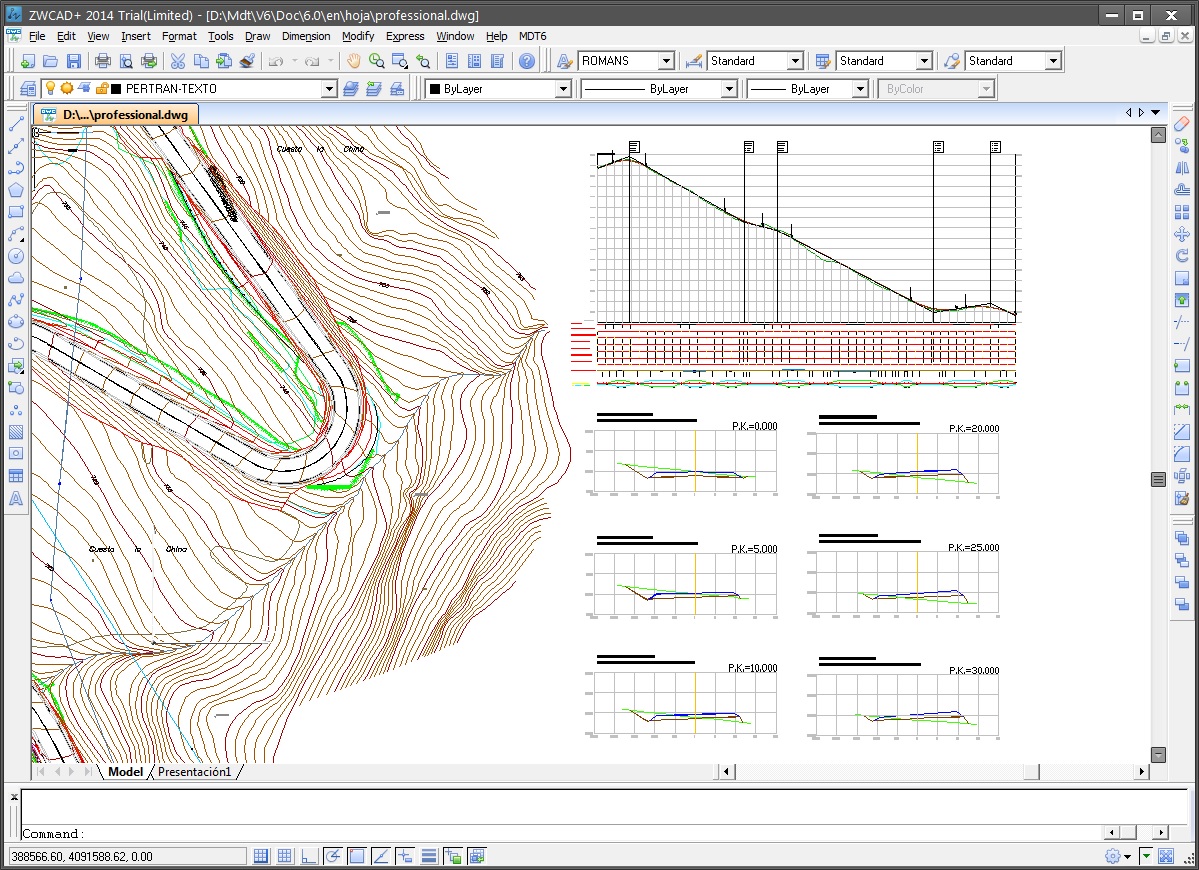
Profiles
Profiles can be computed from triangulation, CAD 3D entities or points near the alignment.
Quick profile command requires a line over the surface and then shows quickly the profile.
Profiles can be modified in a powerful CAD-independent editor.
Drawing is completely customizable. Model or paper space, sheet templates, text style and sizes, numerical data and labels, custom blocks and so on, all of these are adjustable.
Multiple terrains and grade lines can be represented in a single profile, along with their respective vertical transition curves and elevations, height differences, partial distances, distances to origin, curvature and superelevation diagrams, numbering, inserted blocks, road intersection and so on.
Cross-Section Profiles
Cross sections can be computed from points, digital terrain model or 3D drawings. Other utilities allow users to get them from a profile, a simple template, or by converting from a file.
A powerful editor allows advanced graphic and numerical editing of cross sections.
In addition we can see them in real-time based on cursor position over plan view or over the profile in drawing.
The drawing can be highly customized, so that we can use model or paper space, add grids and reference height, and also choose elements to be labeled (station, terrain height, project height, areas and volumes and superelevation).
MDT allows users to draw several cross sections files simultaneously, in order to see the development of works. Also we can insert user blocks over the cross sections, project 3D polylines or points on the drawing.
Another tool creates pipe cross sections by defining pipe diameter, elevation, base height, thickness and material of every layer.
Once the pipe cross section is defined, MDT will draw the cross sections with pipes and gives detailed areas and volumes report.
Vertical Alignments
Vertical alignments can be defined by polyline, parameters (station and elevation or distance and slopes) or importing files.
Vertical curves can be circular, symmetric or asymmetric parabolic, and can be edited by changing its radius, parameter, tangent, maximum ordinate or pass-through point. And MDT can also provide real-time volume information.
The drawing is fully customizable, with different styles and selection of numerical data to be labelled.
There are tools to generate an optimum grade line, shift alignments by station or height, compare, invert or convert from longitudinal profiles.
MDT can generate a visibility report as well as checking maximum slope according to road regulations.
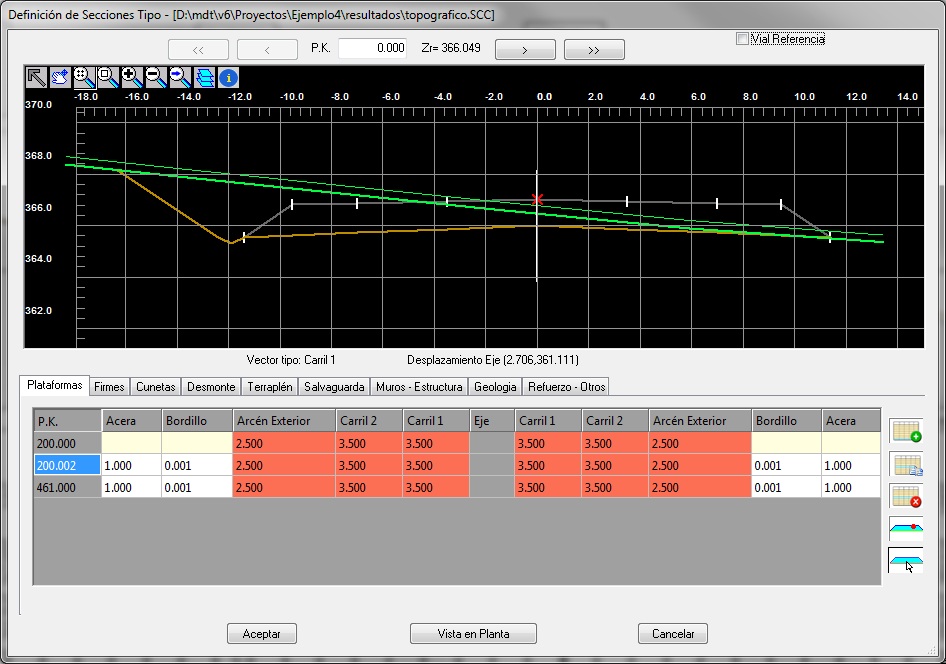
Section Templates
MDT can design road and urban templates. We can customize each of the elements as described bellow.
Platforms are defined by vectors such as lane, shoulder, median, berm, curb, sidewalk… User can build a template library.
We can customize the dimensions and behavior for every vector to decide how to apply superelevation, textures or road layers. In addition, we can build the platform from a drawing.
Roadbeds thickness can be defined for every segment, as well as subgrade conditions (constant slope, parallel, depending on the superelevation or variable). We can apply different slopes at left and right sides as well as inner or outer the median. Also roadbed layers and materials can be defined.
Dicthes are defined by a list of vectors, and can be applied to left or right sides depending on cut or fill terrain. Another option allows you to define it from a road layer. Special ditches can be inserted on head or foot of slope.
Cut and fill slopes. There are many options to define slopes: constant inclination, berms or variable. Slopes can be assigned up to a given height or depending on geology layers. We can also define crown slopes from natural ground with fixed height and slope.
All template elements can be assigned to different station intervals.
In addition, we can define and apply geology layers, walls and structures, reinforcement and expansion for roadway optimization, etc.
Another advanced tool allows us to build automatically the template definition from a road wireframe drawing.
Setting Out
Stations for stakeout can be created by using different methods. /p>
We can stake out single points, points along alignment, station and offset, points at intervals or polyline vertices, by using their own coordinates or referred to stations. Road elements and layers can be staked out as well.
Any point can be analyzed in relation to the horizontal alignment, giving the station, offset and azimuth.
Other unique options are to compare survey points against a digital terrain model or project cross sections, and create a detailed report. Other reports give listings of platform vertices, ditches, slopes, excavation details, etc.
Volumes
Volumes can be computed from grid, surface or cross-sections comparisons.
The results from grids or surfaces can be represented as a mesh with color-coded gradients in cut and fill areas and customizable legend.
The calculation from cross-sections allows users to apply curvature correction depending on project’s horizontal alignment, and remove profile intervals that don't form part of the volume measurement.
The quick volume command estimates percentage of work executed from a coordinate points file or a list of stations and heights values, creating a detailed report.
The volume by template option calculates the cut and fill volumes from a simple template defined by a polyline.
MDT computes also the values for roadbed layers, giving detailed report of cut, fill and topsoil volumes. Other reports give detailed measurements about cross-sections, roadbeds, slopes and so on.
When calculate the earthwork, MDT can take into account dumps and stockpiles as well as transport distance and costs. It also draws mass diagrams with different options.
Maps - Rendering
MDT can draw a three-dimensional grid from a surface or contour lines. Also it can generate thematic maps and draw the slope, aspect or height of a surface, or generate a visibility map from a point.
There are commands to add geo reference images and insert orthophotos at their position, and assign them to a whole surface as a texture or assign textures from the supplied library to a set of triangles. Another library of 3D objects can be used to enhance presentations.
MDT includes a powerful terrain viewer that shows the surface with the textures and 3D objects, with customizable sky and background appearance and shadow, lightning and fog effects. It also has options for measuring 3D distances, quick profile, simulating flood and more.
The road viewer can simulate a route along the alignment or a polyline, and can generate a video in AVI format.
MDT provides access to Web Map Services, and such as those offered by public authorities. The user only needs to specify a window on a screen using projected coordinates, choose the service and then the program will automatically insert an image at the appropriate place.
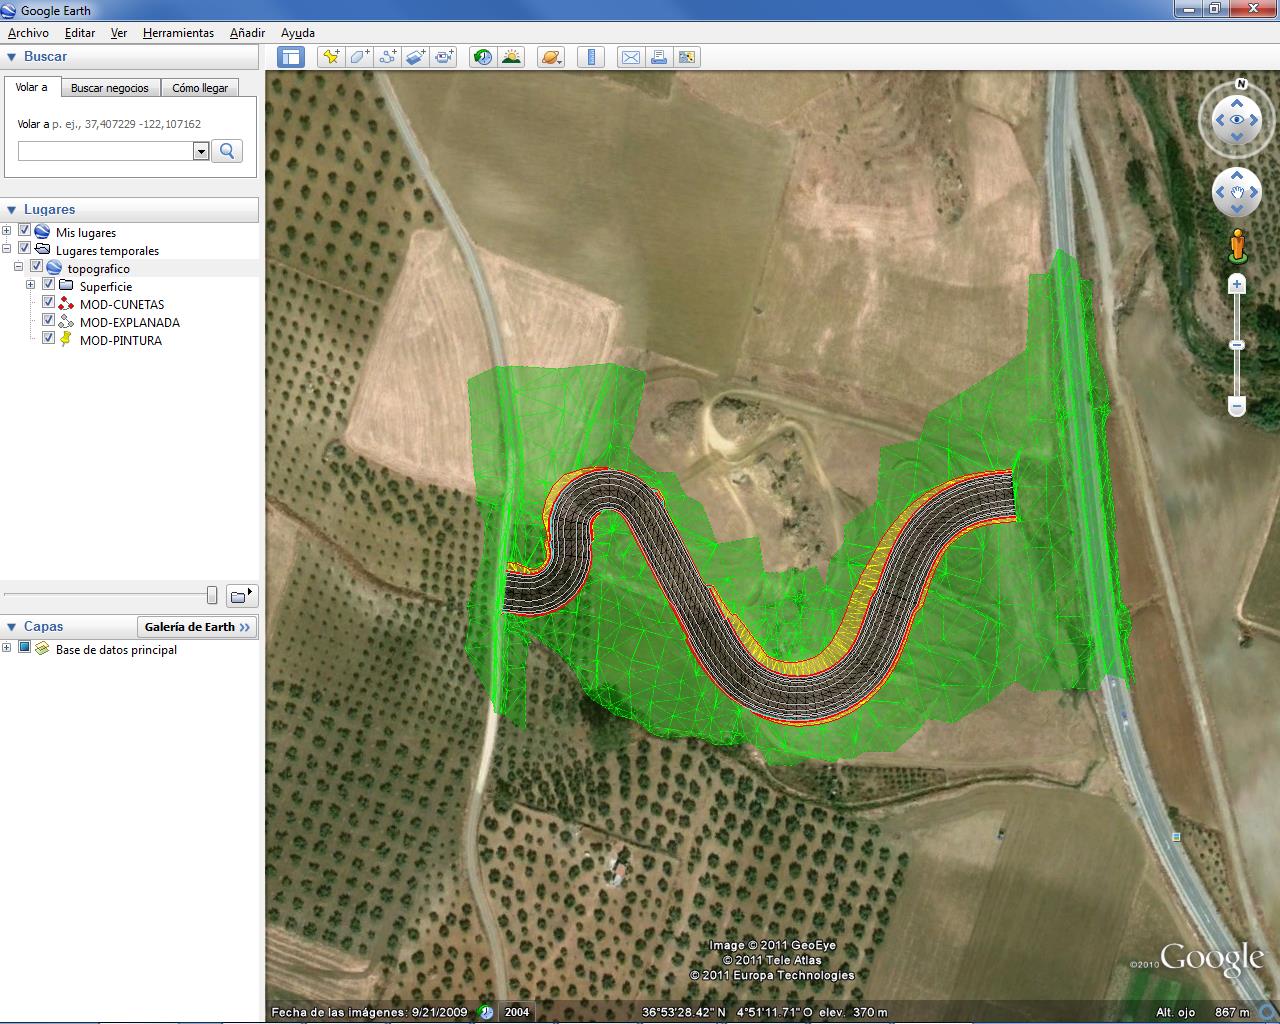
Another utility allows users to export points, surface and drawing layers to Google Earth.
Utilities
MDT has many additional tools such as number objects, drawing of coordinates, division into sheets, slope lines, coordinate grids, layer control and object elevation.
Plot menu includes options to divide plots in specific areas by moving a line parallel or perpendicular to a side, vertex or rotation, and also by other methods. It also dimensions the area of plots and generates detailed reports.
Points management including import/export of many formats
Digital Terrain Modeling creation and editing
Advanced surface operations
Contour generation
Cross sections
Horizontal and vertical alignment design
Template definition
Setting out
Volume calculations
Height and slope maps
Terrain viewer
Utilities for parcels
Follow Us
© 2021 ZWSOFT CO., LTD.(Guangzhou) All rights reserved. Privacy Policy.
All other trademarks cited herein are the property of their respective owners.